#WE ARE
DIFFERENT
Buscador avanzado
Resultados (224)
Mostrando 1 - 9 de 224 resultados
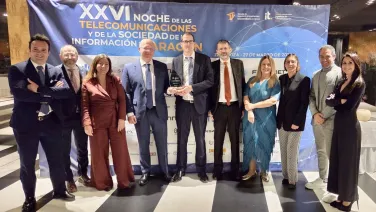
hiberus, ‘Empresa del Año’ en la Noche de las Telecomunicaciones
hiberus ha sido reconocida como Empresa del Año en la Noche de las Telecomunicaciones y de la Sociedad de la Información, un evento que reunió a más de 300 profesionales del sector TIC en nuestra tierra. Fue una velada muy especial, en la que pusimos en...
hiberus se proyecta hacia los 350 millones de euros en 2026
Desde hiberus hemos crecido por encima del 20% en 2025. Con este resultado, hemos multiplicado por cuatro nuestra cifra de negocio en los últimos cinco años y nos convertimos en la consultora española de mayor crecimiento del sector. A diferencia de gran...

Google e hiberus, aplicación real de la IA en los medios
Henneo, Hola, Hearst, Webedia, Godó, Vocento, El Español, RBA, Grupo Joly y El Diario han participado en Google AI Lab for Publishers, el programa impulsado por Google y liderado y ejecutado desde hiberus para trasladar la IA generativa a la realidad...
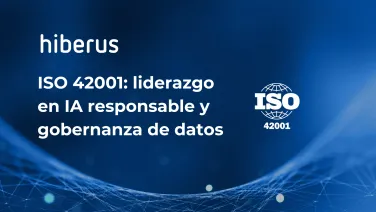
hiberus obtiene la ISO 42001: liderazgo en IA responsable
La Inteligencia Artificial tiene un potencial enorme… pero el verdadero reto está en cómo la usamos.Como explica nuestro CEO, Sergio López, "En hiberus hemos decidido que la transparencia no es negociable". Por eso, estamos orgullosos de anunciar que somos...
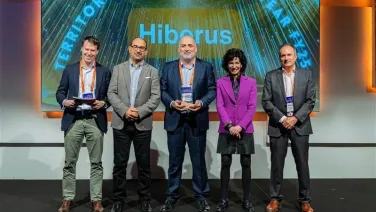
hiberus, premio 'Partner de Territorio' de Palo Alto Networks
En hiberus hemos sido distinguidos con el premio “Partner de Territorio” de España 2025, otorgado por Palo Alto Networks durante la celebración de Xchange España 2026, uno de los principales encuentros del ecosistema de partners de la compañía en nuestro...
hiberus obtiene el nivel Advanced Delivery Partner de monday.com
En hiberus hemos dado un paso más en nuestra alianza estratégica con monday.com al obtener el nivel Advanced Delivery Partner, un reconocimiento oficial que valida nuestro nivel de expertise técnico y capacidad de entrega avanzada en implementaciones sobre...
hiberus obtiene la AWS AI Services Competency
En hiberus hemos obtenido la Certificación de AI Services de AWS, un reconocimiento oficial que avala nuestro conocimiento, experiencia y buenas prácticas para d iseñar, implementar y operar soluciones de Inteligencia Artificial sobre Amazon Web Services...
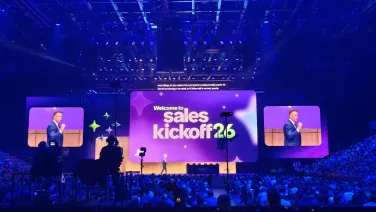
hiberus en ServiceNow Sales Kick Off & Partner Kick Off 2026
Arrancamos 2026 participando en el Sales Kickoff & Partner Kickoff de ServiceNow en Las Vegas, un evento clave para alinear nuestra visión, definir estrategias y planificar los próximos desafíos junto al ecosistema de partners y el propio fabricante. Como...
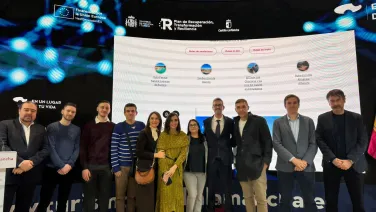
hiberus impulsa la digitalización del turismo en Castilla-La Man
Desde hiberus hemos sido socio tecnológico líder en el desarrollo de la nueva Plataforma Digital de Turismo de Castilla-La Mancha, un proyecto innovador que integra más de 30 webs y verticales turísticos en un único ecosistema inteligente y centrado en el...